How Level One Labs Cut Sample Prep Time in Half with Confident LIMS
Level One Labs cut sample prep time by 52% and eliminated data entry errors with Confident LIMS. See how this Arizona cannabis lab transformed operations.
READ MOREAnalytics dashboards are now live in the Confident Client Portal: free Volume dashboards for everyone, plus 19 advanced dashboards for Client Pro.

Your testing data has been telling a story all along. Until now, reading it meant exporting CSVs, building spreadsheets, or asking your lab to pull numbers for you.
That changes today. Confident LIMS (Laboratory Information Management System) now includes a plethora of new-and-improved data analytics dashboards directly in your Client Portal. Every client gets two Volume dashboards free, and clients on the Client Pro plan unlock the full suite of 21 dashboards covering test results, turnaround times, expenses, payables, prices, and market share. Each dashboard shows only your organization's data, filters down to the exact slice you need, and exports to your preferred format (CSV, PDF, JPG) in one click.
Here is what is new, what it answers, and how to get it.
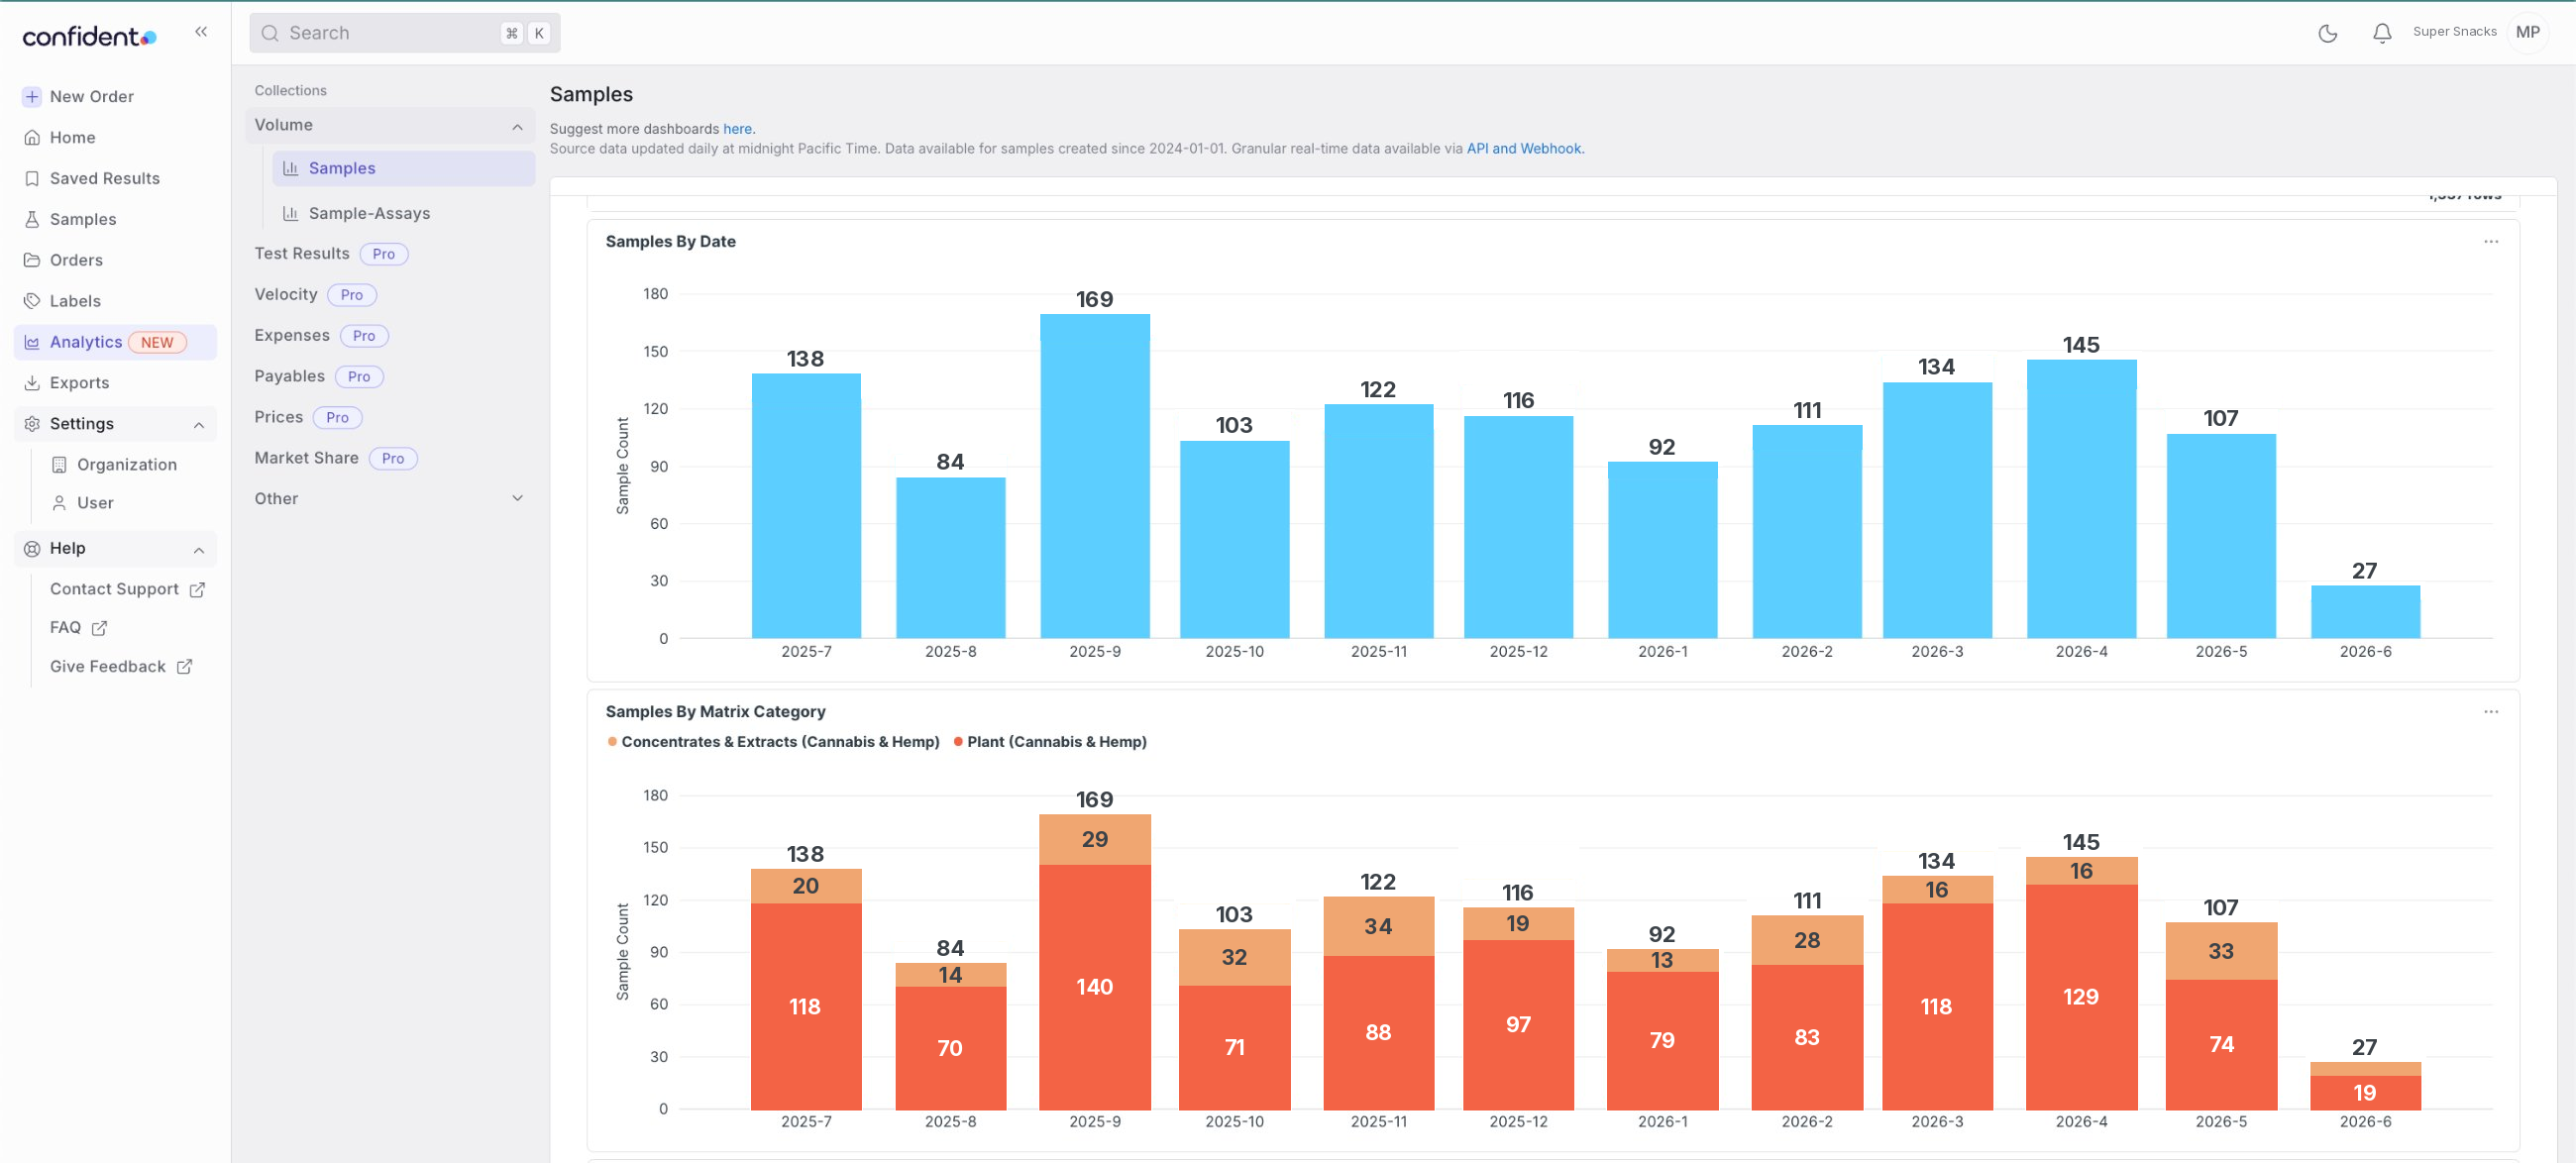
When you submit samples for testing, you already generate a steady stream of valuable data: how much you test, what you test for, how fast results come back, and what it all costs. But that data lived inside individual orders and Certificates of Analysis (COAs), useful for viewing one result at a time, hard to see as a trend.
Clients told us they wanted answers to practical questions. Are my potency values drifting? Which assays fail most often? Is my turnaround time getting better or worse? What am I actually spending on testing this quarter?
Manual spreadsheets or custom-built tools can answer those questions. They just should not have to.
Your Analytics tab now includes a Volume collection, available to every client at no cost:
Clients on the Pro plan get everything in Free, plus 19 additional dashboards across six collections:
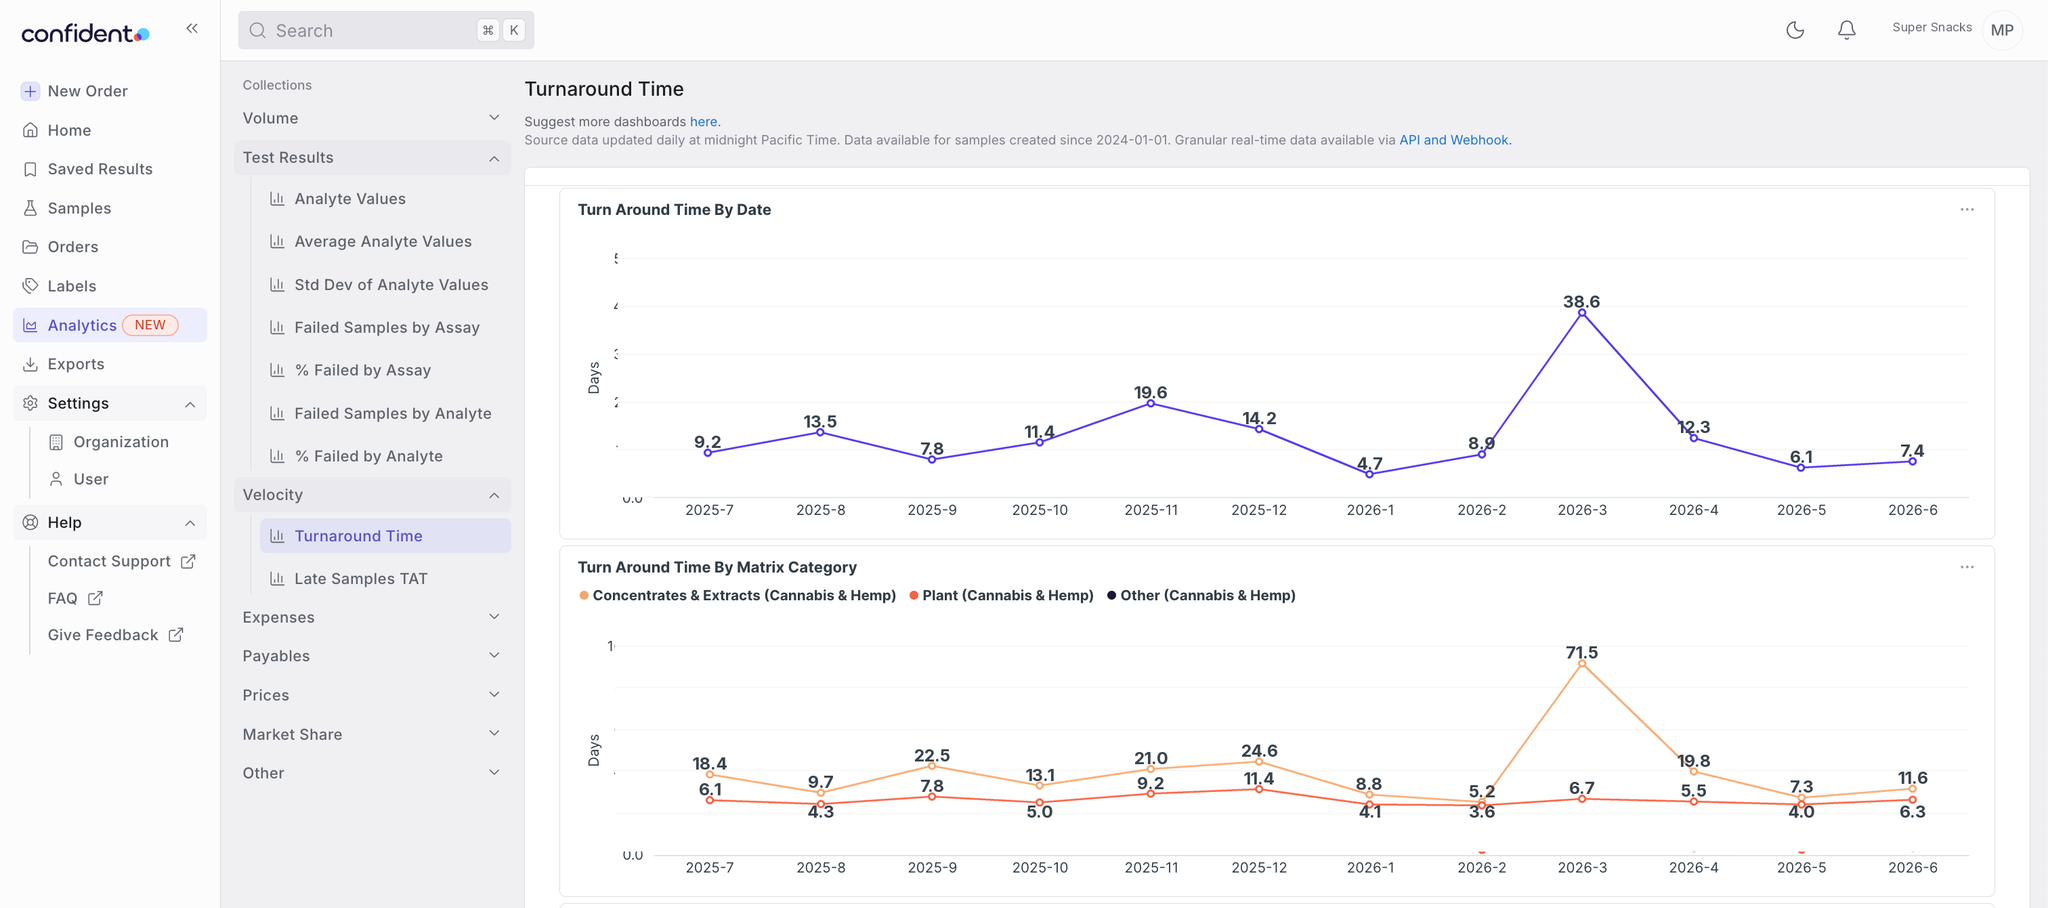
Every dashboard shares the same filter set: date range, lab, matrix category and type, assay, analyte, test package, industry, compliance status, and rush. The default view shows your last 12 months. Need only the rush samples from one lab, for a single assay, in Q1? Three clicks.
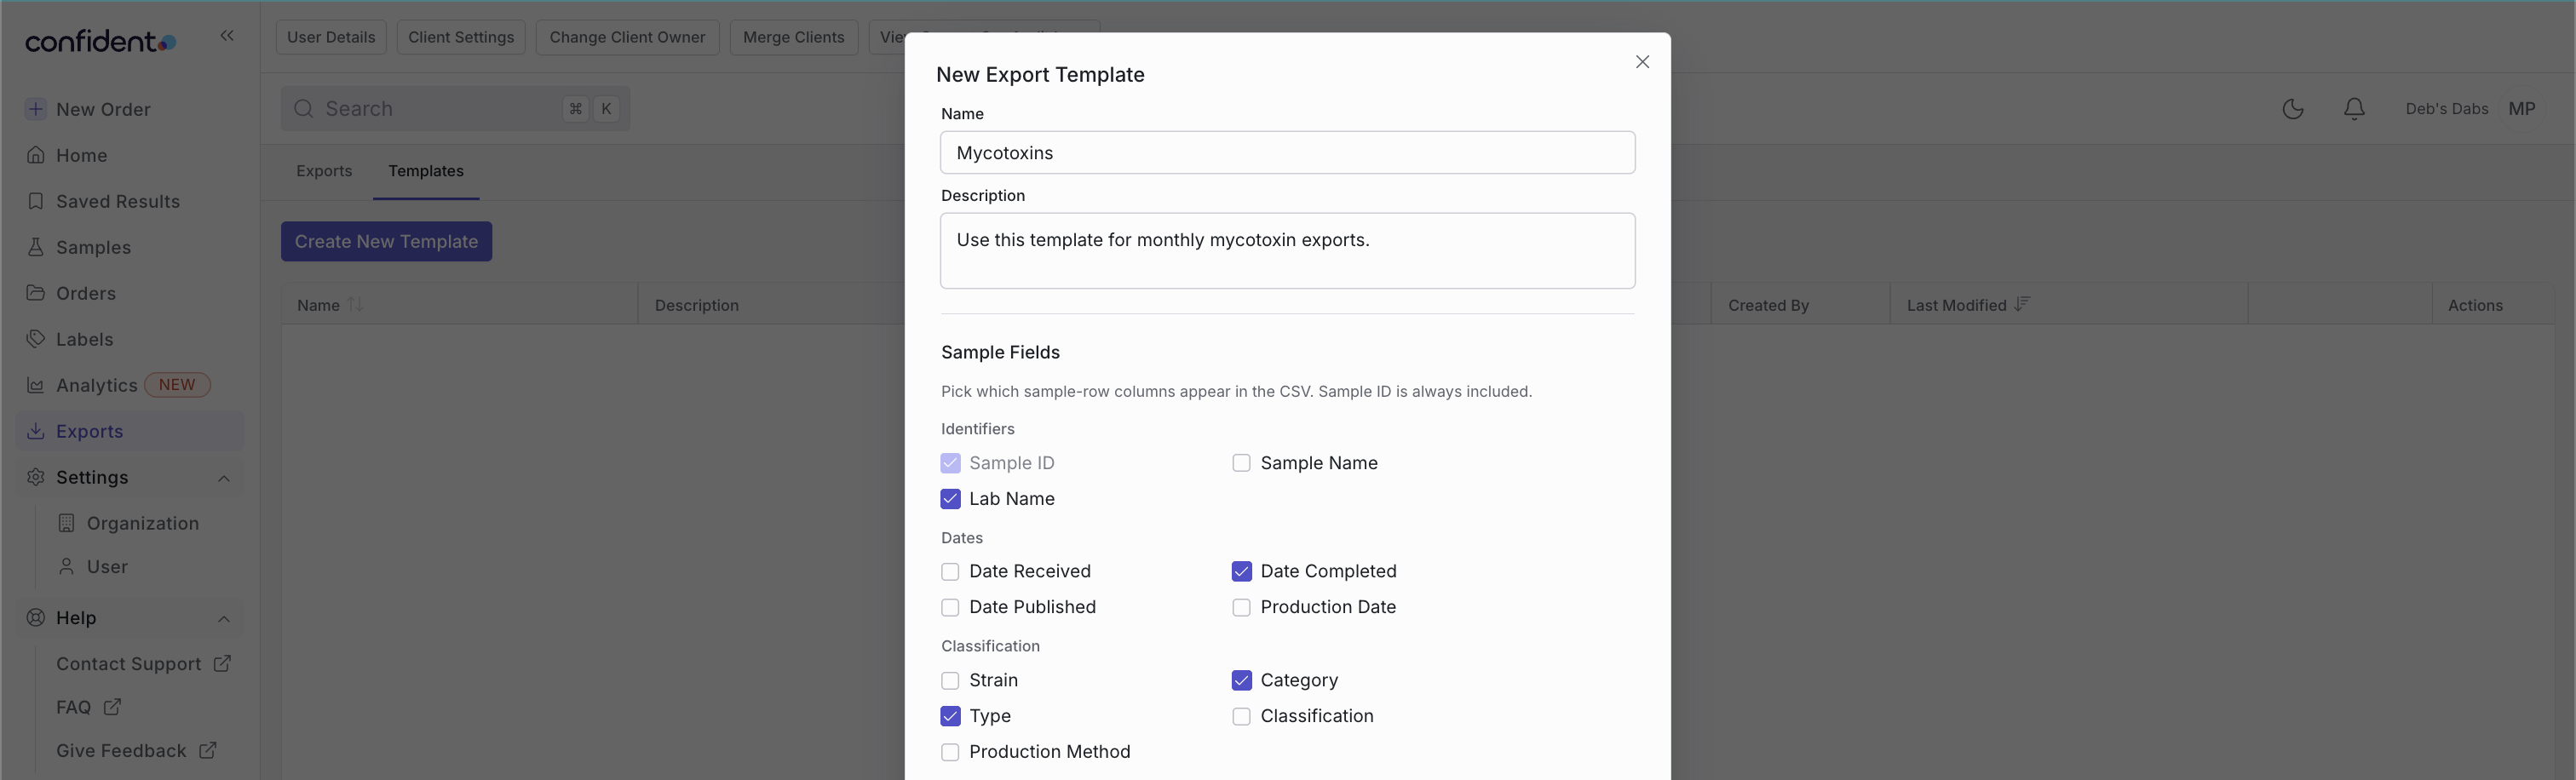
Every dashboard and individual chart downloads as CSV, JPG, or PDF. Pro clients can also create and save configurable CSV export templates: choose the exact sample fields, assays, and analytes you want, save the template, and reuse it on every export.
Dashboards refresh daily between midnight and 6am PT, so same-day data may lag slightly. Each dashboard automatically filters to your own organization using the same authentication that secures the rest of your Confident account, so your data stays yours.
Advanced Analytics joins the rest of the Client Pro plan, all under one subscription:
One plan, not five. If you already pay for API access, you already have Pro, and the new dashboards are waiting in your Analytics tab.
Upgrading is self-serve. In your account, click the Pro icon in the side navigation, on any Pro-badged dashboard, or on the Integrations page. You will see pricing for your organization, based on your monthly sample volume, and everything included in the plan. Payment happens right in the app.
Dashboards refresh once a day between midnight and 6am PT, and they only count samples and orders processed through Confident. If you track outside testing in your spreadsheet, the totals will differ.
Yes. Every dashboard and individual chart has a download button supporting CSV, JPG, and PDF formats.
No. Dashboards live in your existing Analytics tab and work with point-and-click filters. No API, no query language, no setup.
Fully anonymized comparisons between your sample volume and similar trends across the Confident network, under the same filters you apply to your own data.
Four step-by-step guides cover the details:
Log in and open your Analytics tab; your Volume dashboards are already there, populated with your last 12 months of testing. And if you want the full picture across results, velocity, spend, and market share, Pro is one click away.
Not on Confident yet? Join a network of 15,000+ testing clients who get their results, data, and analytics in one place. Sign up for free and begin testing with labs.
Questions? Reach us anytime at support@confidentlims.com.
Let's share!

Level One Labs cut sample prep time by 52% and eliminated data entry errors with Confident LIMS. See how this Arizona cannabis lab transformed operations.
READ MORE
Cannabis testing labs must meet ISO/IEC 17025, METRC or BioTrack integration, and strict chain-of-custody rules in 2026. Learn how to stay compliant.
READ MORE.avif)
Discover how modern LIMS delivers real ROI by reducing labor costs, increasing lab throughput, and ensuring audit-ready compliance. Learn how labs scale smarter.
READ MORE


