21 CFR Part 11 & ISO 17025 in Practice: What Your LIMS Must Actually Do
21 CFR Part 11 and ISO 17025, clause by clause: audit trails, e-signatures, document control, and what your LIMS must actually do.
READ MORE
New Analytics dashboards in Confident LIMS: turnaround time, test-result trends, client activity, benchmarks, unpaid order balances. Options on every plan.

Every lab already has the data. It's sitting in sample records, test results, invoices, and client accounts. The problem is that turning it into a decision usually means exporting to a spreadsheet, building the same pivot table again, and hoping nobody changed a column name.
🎧 Prefer to listen? Here's the full audio version of this article:
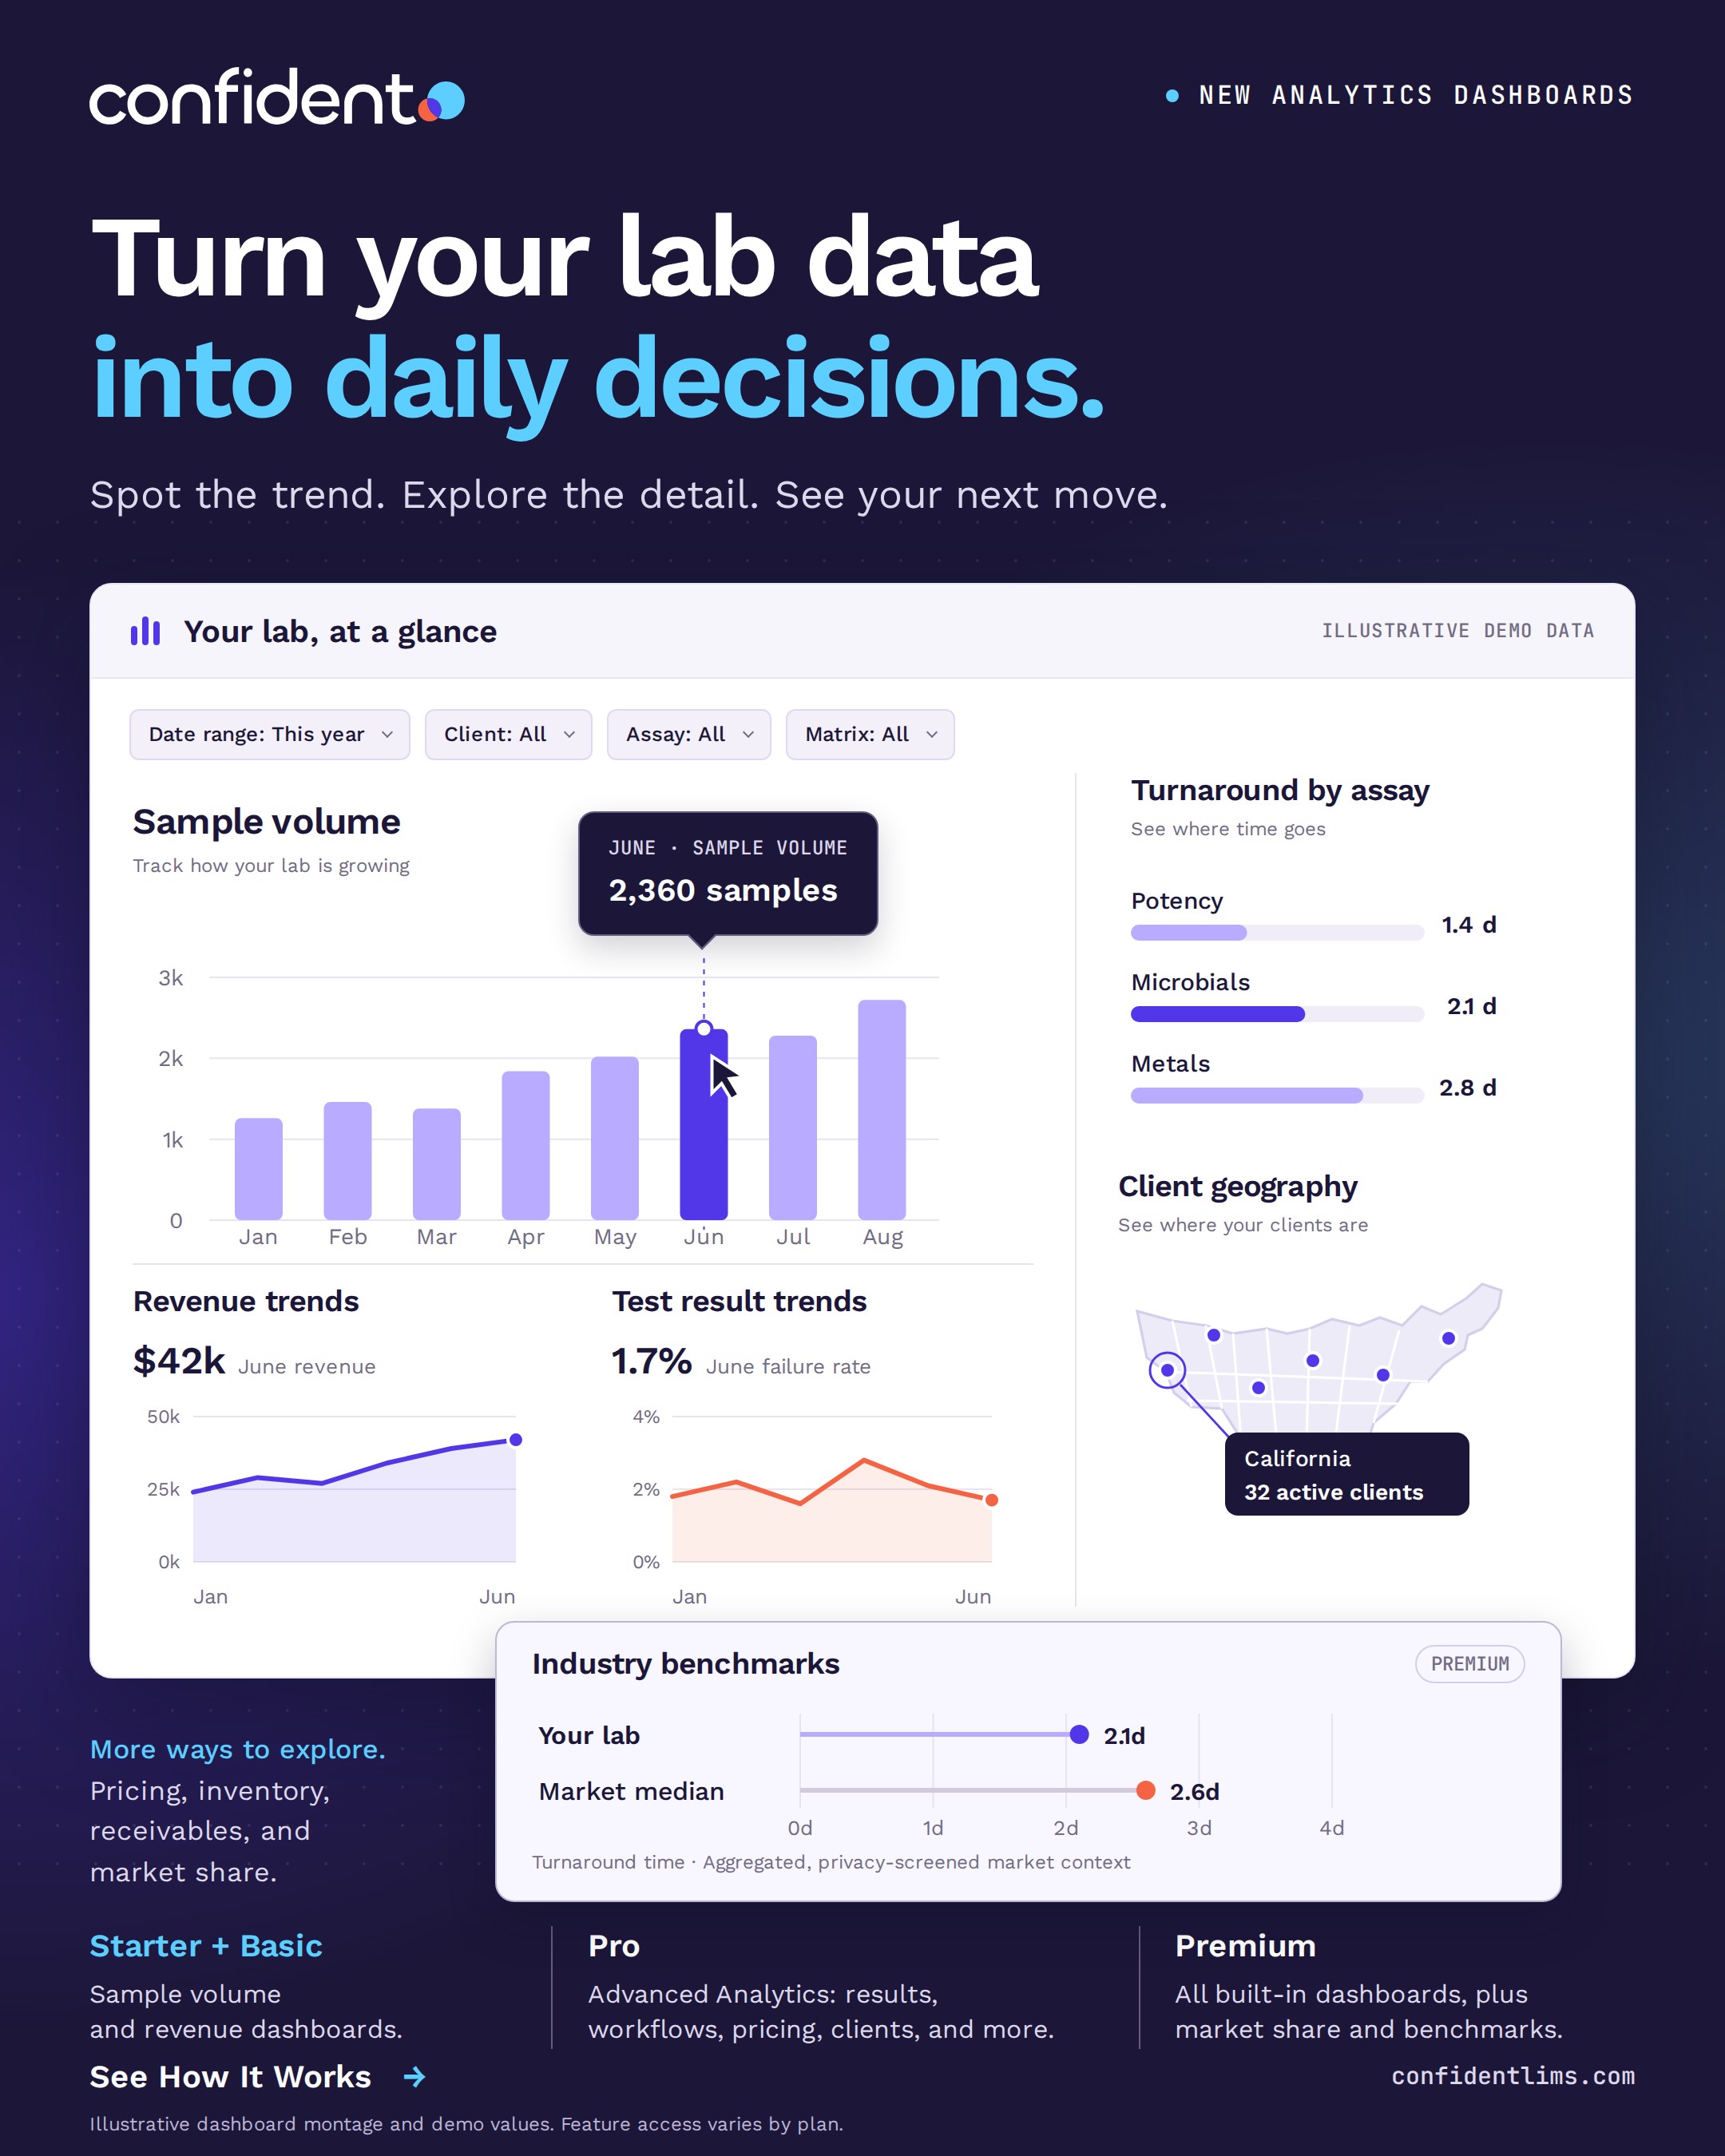
That changes today. Confident LIMS (Laboratory Information Management System) now includes a new set of Analytics dashboards, with options on every plan. They cover the questions lab managers ask every week: where samples spend their time, how test results are trending, what's happening with each client, where your volume and revenue concentrate, and which order balances are still unpaid.
In short: the new Confident Analytics dashboards give analytical testing labs a shared view of turnaround time, test-result trends, client activity, market position, and unpaid order balances, without exporting anything. Lab-specific dashboards use your lab account's own data. Premium benchmarks add aggregated, privacy-screened market data. The dashboards refresh daily at midnight Pacific Time and cover samples from January 1, 2024 onward.
Here's what your team can do with them.
Turnaround time is the number your clients judge you on, and it's usually the last number anyone looks at. By the time a monthly report shows it creeping up, the samples that caused it are long gone.
The workflow dashboards make that visible earlier. You can see how long samples sit in each assay status, which statuses take the longest, and how long in-progress samples have been open. Average and median time in assay statuses live on separate dashboards, so you can compare the two and tell everyday friction apart from one-off outliers. A single rerun that took nine days shouldn't look like a systemic problem, and a steady two-hour drift shouldn't hide behind a good average.
One thing worth knowing: Overdue Samples shows samples that were already published late. It's a record of what happened, not a prediction of what's about to. Read it as the scoreboard, and use the in-progress views to see what's still in play.
Dashboards: Turnaround Time, In-Progress Samples Aging, and Overdue Samples.
Shifts in test results rarely announce themselves. They show up as a slow move in an analyte average, a widening spread on one matrix, or a failure rate that ticks up for a single client's product line.
You can now track analyte averages, variation, and failure rates by assay, matrix, package, client, or date. These views are built on published results, so what they show you is what your clients already received. A change in an average or a failure rate is a reason to go and look, not a finding in itself — the dashboards tell you where to point your investigation, and your QA process tells you what it means.
A note on the math: the variation metric divides the standard deviation by the mean, so it stays comparable across analytes that sit at very different concentrations.
Dashboards: Analyte Values, Standard Deviation Analyte Values, and Failed Samples.
Most client check-ins run on anecdotes. Someone remembers that an account "seemed quieter lately" or that "they had a few fails last quarter." That's not a great way to protect revenue.
Use client filters where available to review an account's volume, revenue, turnaround time, and test-result trends. Your team walks into the conversation with something specific: which products are growing, which tests are failing, and whether your turnaround time for that client is holding up. Not every dashboard carries a client filter — inventory and market benchmark views work at a different level — but the account-level ones do.
Dashboards: Active Clients, Churned Clients, and Sample Revenue.
Where does your volume come from? Where does your revenue concentrate? Which regions have active clients and which ones don't? Those are strategy questions, and until now they took a spreadsheet and an afternoon.
The market dashboards show where volume, revenue, and active clients sit across your book of business. On Premium, market benchmarks go further: you can compare your pricing, turnaround time, and failure rates against aggregated, privacy-screened market data. If a region is paying more for slower results, that's a market worth a closer look.
Dashboards: Market Share, Market Benchmarks, and the Revenue, Volume, and Active Clients Maps.
Unpaid balances are a lab problem as much as a finance problem. Every unanswered "what do we owe you?" email costs someone on your team a detour through the billing system.
Review unpaid order balances by client, geography, and time since order receipt, with order-level detail behind every number. Note that this is order aging, not invoice aging: balances are counted from when the order came in, not from an invoice date or payment terms. Your billing team can answer a client's question in the same call, without building another spreadsheet.
Dashboards: Receivables, Receivables Schedules, and Order Revenue.
There are options on every plan, and what you get depends on your tier:
Lab-specific dashboards use your lab account's own data. Premium benchmarks add aggregated, privacy-screened market data, so you can see the market without anyone seeing you.
🎧 Short on time? Here's the podcast brief:
No. They're live in your Confident account and built from the data your lab already records. Log in and open Analytics.
Dashboards refresh daily at midnight Pacific Time, and sample history runs from January 1, 2024 onward. They're a daily operating view rather than a live monitor.
Advanced Analytics is Pro and Premium. Market benchmarks are Premium only. Starter and Basic include the built-in sample volume and revenue dashboards.
No. Benchmarks are aggregated and privacy-screened. They add market context without exposing any individual lab's data, including yours.
Where available, yes. Account-level dashboards carry client filters for volume, revenue, turnaround time, and test-result trends. Inventory and market benchmark dashboards work at a different level and don't.
If you're a Confident customer, this update is already live in your account. Log in and explore, or read the step-by-step guide in our help center: How do I use Analytics dashboards to analyze my data?
If you're still running your lab on exports and pivot tables, this is a good week to see what a LIMS built for analytical testing looks like. Get Demo
Questions? Reach us at support@confidentlims.com.
Let's share!

21 CFR Part 11 and ISO 17025, clause by clause: audit trails, e-signatures, document control, and what your LIMS must actually do.
READ MORE
Configurable vs customizable LIMS: one means settings, the other means code. See why the difference decides your go-live timeline and ongoing cost.
READ MORE
Peptide testing demand is rising fast. See what a peptide testing lab must confirm — identity, purity, quantity — and what a configurable LIMS needs to keep up.
READ MORE


